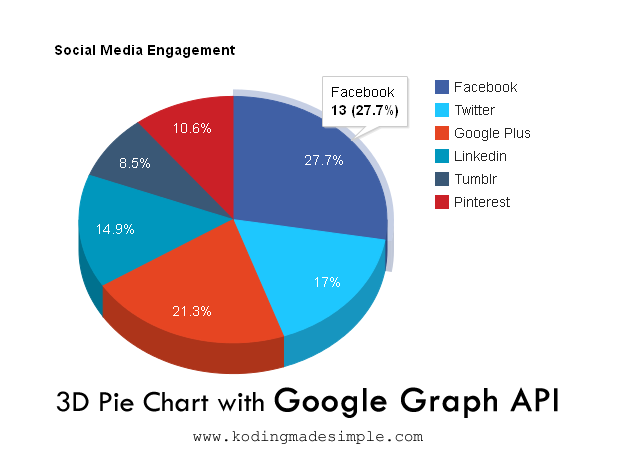
Google Charts API provides you with ready-made charts which you can generate with few lines of java script code. I'll show you here how easy it is to Create 3D Pie Charts with JavaScript and Google Charts API. For this chart tutorial we are going to use Google's Visualization API which is based on pure HTML5/SVH technology, so you don't need extra plug-ins. The pie chart we generate is an interactive chart, which means the user is allowed to interact with them by triggering events like mouse over, clicking, zooming, panning and much more (depends upon the charts we use).

This method is relatively simple and does not require any complex server side scripts like PHP or any Databases. Using java script we will make callback to the Google Visualization API with the data set we want to render as a pie chart. The charts will be generated at the time of presentation. So if you want to generate charts from database tables, you can simply make it by querying the data from the DB tables and pass it to the Google API with an AJAX call.
Create 3D Pie Charts with Javascript and Google Charts API
For this Google Charts API example, Let me create a chart showing the user's various social media engagement.
Recommended Read: How to upload files in php securely
First let's include the required Google chart library.
<script type="text/javascript" src="https://www.google.com/jsapi"></script>
Next load the google visualization api with the load() function.
google.load("visualization", "1", {packages:["corechart"]});
- The first parameter
visualizationtells to load the google visualization api. - The second parameter
1instructs to load the current version of api. - The third parameter
{packages:["corechart"]}is an array of visualizations we want to use.
Next we have to set callback to make sure the visualization library is completely loaded.
google.setOnLoadCallback(drawPieChart);
The drawPieChart is the java script function where we'll set up the data and options to be actually rendered as a graph.
function drawPieChart() {
    var data = google.visualization.arrayToDataTable([
        ['Platform','Reach'],
        ['Facebook',13],
        ['Twitter',8],
        ['Google Plus',10],
        ['Linkedin',7],
        ['Tumblr',4],
        ['Pinterest',5]
    ]);

    var options = {
        title: 'Social Media Engagement',
        width: 900,
        height: 500,
        colors: ['#4060A5', '1EC7FE', '#e64522', '#0097BD', '#3a5876', '#cb2027'],
        is3D: true
    };
    var chart = new google.visualization.PieChart(document.getElementById('piechart'));
    chart.draw(data, options);
}
As you can see in the above example, I have set the data table and the options. The options hold the general settings of the chart like the title, the dimensions (width and height) etc. Since I have created a pie chart about various social media reach in the above example, it's only meaningful to set the background colors of those corresponding slices with their brand colors. If it is not set, they will be generated with the default color theme. So I have defined the colors array to generate the chart like I would prefer.
To make the pie chart 3D I have used,
is3D: true
By default this property would be false. You can leave it if you don't want a 3D chart.
Finally used the draw() function to generate the actual graph.
Also in the line,
var chart = new google.visualization.PieChart(document.getElementById('piechart'));
you can see there is a DOM reference to the html element with id piechart which is the actual place holder for our 3D Pie Chart.
<div id="piechart"></div>
Here is the completed code for creating 3d pie charts with javascript and google charts api.
<html>
    <head>
        <title>Create 3D Pie Charts with JavaSript and Google Charts API</title>
        <script type="text/javascript" src="https://www.google.com/jsapi"></script>
        <script type="text/javascript">
        google.load("visualization", "1", {packages:["corechart"]});
        google.setOnLoadCallback(drawPieChart);
        function drawPieChart() {
            var data = google.visualization.arrayToDataTable([
                ['Platform','Reach'],
                ['Facebook',13],
                ['Twitter',8],
                ['Google Plus',10],
                ['Linkedin',7],
                ['Tumblr',4],
                ['Pinterest',5]
            ]);

            var options = {
                title: 'Social Media Engagement',
                width: 900,
                height: 500,
                colors: ['#4060A5', '1EC7FE', '#e64522', '#0097BD', '#3a5876', '#cb2027'],
                is3D: true
            };
            var chart = new google.visualization.PieChart(document.getElementById('piechart'));
            chart.draw(data, options);
        }
        </script>
    </head>
    <body>
        <div id="piechart"></div>
    </body>
</html>
Now run it in the browser and you can see a beautiful 3d pie chart generated.
As I've already said it's an interactive chart, hover the mouse over the pie slices and you can see a nice tooltip appears mentioning the given name and shared percentage of the slice.
Recommended Read: How to get the Status Code from HTTP Response Headers in PHP
Over to you
Do you like this 3D pie charts using java script tutorial? Then what are you waiting for? Go ahead and power up your site's user experience with Google Charts API. Not to mention I would appreciate your kindness to share it your social media circle :)

No comments:
Post a Comment